Motivation
Often in pharmaceutical analysis it helps to have the structure of the molecule alongside key properties one is interested in evaluating. A table displaying the structure with some molecule-derived information is often the preferred format. In this post I explore how to use R to achieve this goal. At the same time, we’ll explore how Python and R can be used together, as promised in the last post where I examined how R can be used for input display and writing to file of two common chemical formats with packages that are native to R.
This time I’ll make use of RDKitlibrary, a Python library that has been of great
interest for me to explore for a while. The library reticulate will helps us
call Python libaries and use them within R without having to leave RStudio.
Reticulate Setup
To load reticulate some setup is necessary. Systems can have multiple versions
of Python installed which can make selection a little difficult. From the
different ways possible, I found that using reticulate with mini-conda the most
straightforward way of getting started. When installing reticulate the package
will recommend to create a mini-conda installation. I suggest you do this
and use the py_install functions in reticulate to install RDKit.
Remember to make sure you have reticulate installed by calling the install function.
install.packages("reticulate")
Once reticulate is installed, the necessary packages need to be loaded and
the Python environment needs to be set up to be used for the reticulate session.
library(reticulate)
library(tidyverse)
library(flextable)
library(magrittr)
library(data.table)
library(magrittr)
reticulate::use_condaenv("r-reticulate")
Installing RDKit can be achieved by the py_install() function as shown below.
reticulate::py_install("rdkit")
With setup out of the way reticulate is ready to run Python code in RStudio and we are on our way to building tables with chemical structures in them.
Testing Reticulate Works
There are two ways to speak Python with reticulate. Python code can be written directly into the notebook or Python functions can be imported into R and used as regular R functions.
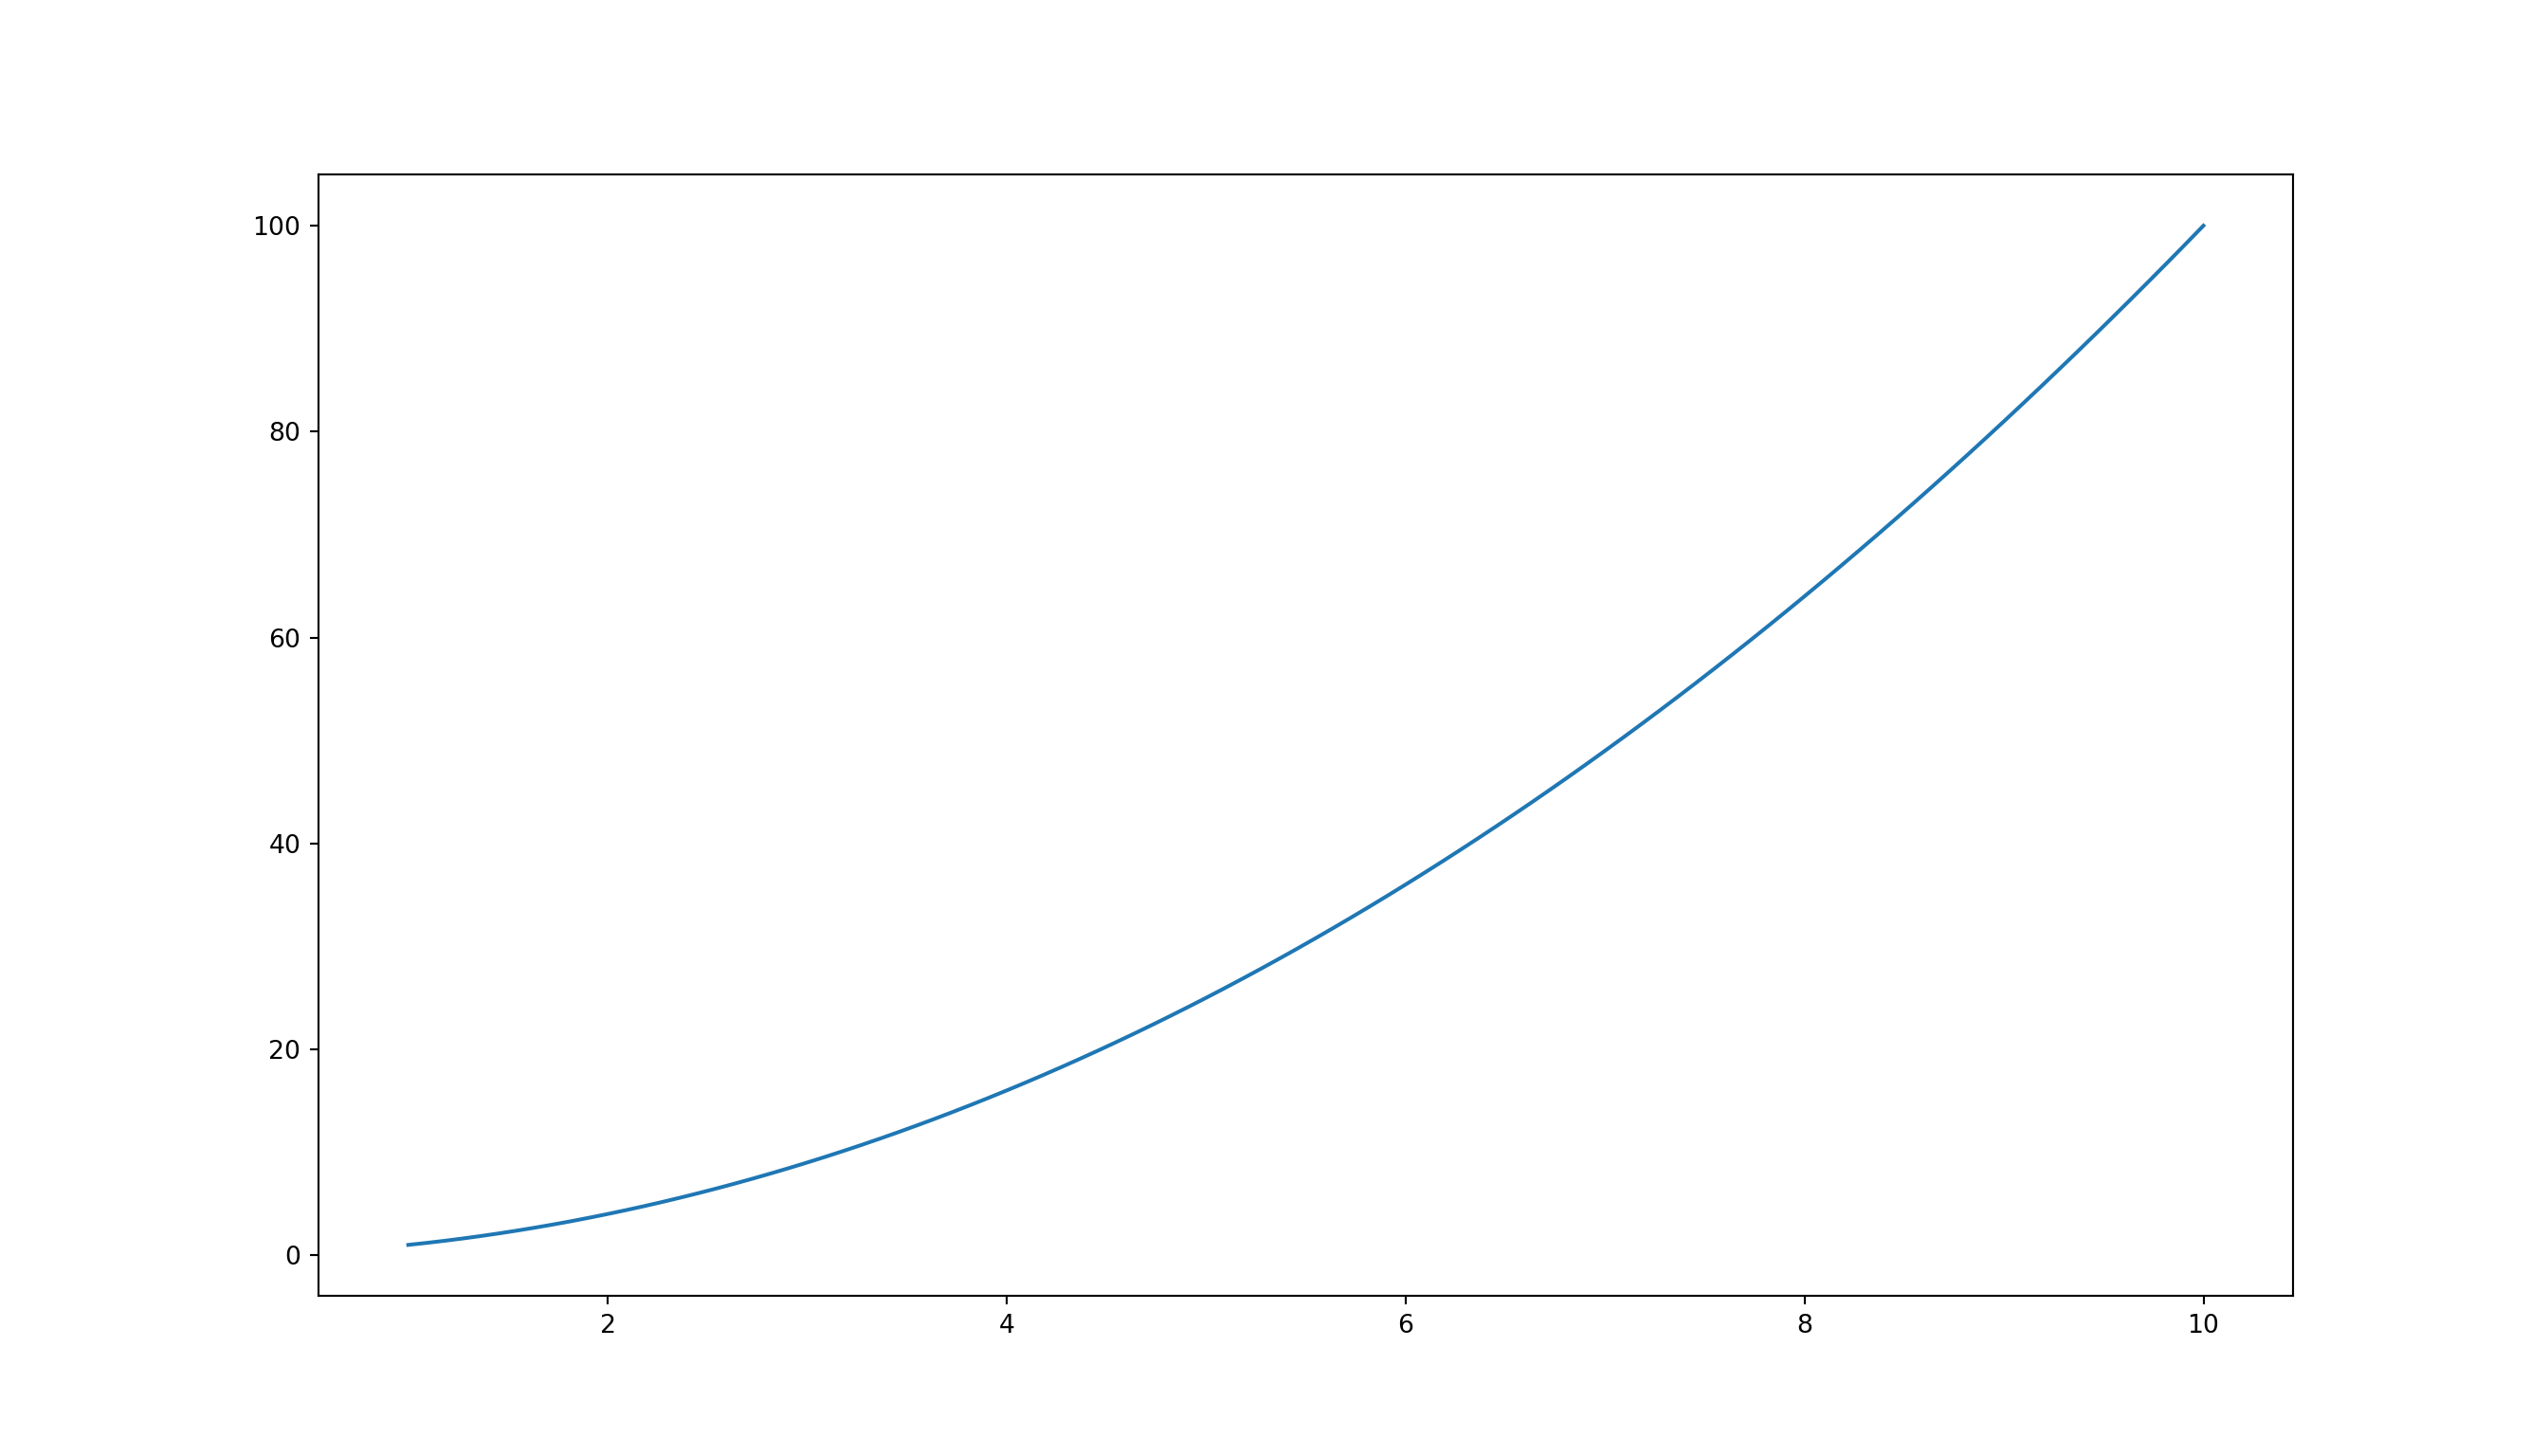
Here’s my attempt at writing Python straight from R using a matplotlib example.
In order for the code chunk to run we start a new chunk as we would usually do
and embrace it in curly parenthesis with {python} instead of {r}. Python code
can then be written as it would normally be written in a jupyter notebook or
any other Python editor. Formatplotlib the results will be shown inline as
in any other chunk written in R.
import pandas as pd
import matplotlib.pyplot as plt
import numpy as np
x = np.linspace(1,10,100)
y = x**2
fig = plt.figure(figsize=(14,8))
plt.plot(x,y)
plt.show()
Other png outputs from Python like the PIL image format may need to be saved to
file first and then read into R via knitr::include_graphics() or via Rmarkdown
image referencing mechanism.
Reticulated Chemistry
In the spirit of getting an output as fast as possible let’s create a display
function using RDKit that can show molecules inline. The function and logic
are modified from the nice implementation developed by Lars Richter.
# Assign needed RDKIT python libraries to r functions via reticuale::import()
Chem <- reticulate::import("rdkit.Chem")
Draw <- reticulate::import("rdkit.Chem.Draw")
Plt <- reticulate::import("matplotlib.pyplot")
AllChem <- reticulate::import("rdkit.Chem.AllChem")
# Use caffeine as an example for molecular display
caffeine <- "CN1C=NC2=C1C(=O)N(C(=O)N2C)C"

display_structure <- function(mol){
    molecule <- Chem$MolFromSmiles(mol)
    filepath <- fs::path(mol, ext = "png")
    Draw$MolToFile(molecule, filepath)
    knitr::include_graphics(filepath)
}

display_structure(mol = caffeine)
N(C(=O)N2C)C.png)
Notice above how the function Chem <- reticulate::import("rdkit.Chem") is
replicating the import pandas as pd role in the python code chunk. This
allows to store the functions of that particular RDKit library in an R object.
Each one of Chem’s functions can then be accessed with the dollar $ operator.
In the previous chunk, I am importing several of the libraries from RDKit that
are used for displaying chemical structures.
Displaying Mutiple Molecules
To display multiple molecules let’s first create a vector containing our gastronomy inspired set of example molecules.
multiple_smiles <- c(
  paste0("O=C(N(C(C1=C(C(OC([H])([H])[H])=C(O[H])C(=C1[H])[H])[H])",
         "([H])[H])[H])C(C(C(C(C(=C(C(C([H])([H])[H])(C([H])([H])[H])[H])",
         "[H])[H])([H])[H])([H])[H])([H])[H])([H])[H]"
         ), # Chili
         "CCO", # Rum
         "CN1C=NC2=C1C(=O)N(C(=O)N2C)C" # Coffee
                 )
chemical <-   c("Capsaicin", "Ethanol", "Caffeine")
source   <-   c("Chili", "Rum", "Coffee")
Displaying a molecule grid with RDKIT in Rmarkdown can similarly be achieved with the following function.
display_grid <- function(multiple_smiles,
                         size = 800,
                         nrow = length(multiple_smiles)
                         ){

# mapping with python functions
mol_list <- purrr::map(multiple_smiles, Chem$MolFromSmiles)

filepath_grid <- fs::path("plot_grid", ext = "png")

img <- Draw$MolsToGridImage(mol_list,
                            molsPerRow = as.integer(nrow),
                            # Set the size of each molecule in the grid
                            # as.integer() is a necessary part for python to interpret
                            # correctly the input
                            subImgSize = c(as.integer(size), as.integer(size))
                            )

    img$save(filepath_grid)
 knitr::include_graphics(filepath_grid)

}
display_grid(multiple_smiles)

Notice how we can use purrr::map with a Python function that has been imported
to R as we would with any native R function. Since the the RDKit libraries are
loaded in the global environment they are accessible to all the
functions in this document. For a more robust implementation, assignment from
the Python libraries should probably be done inside of each function.
There are some peculiarities with working with Python code from R. For example,
when calling Draw$MolsToGridImage the molsPerRow argument requires its input
to be a strict integer and does not coerce a double input to integer
automatically. Therefore we need to convert its input to integer for the
function to work properly.
For more details on reticulate’s capacity to intercovert between R and python’s structures I found reticulate’s cheat sheet to be a good reference.
Chemical Tables
To achieve our intended goal let’s use RDKit to create a function that converts SMILES and chemical names into chemical images saved to a directory. Then we can read the images from the directory into the flextable library to build our chemically aware table.
save_structure <- function(smiles, chemical, path){

Chem <- reticulate::import("`RDKit`.Chem")
Draw <- reticulate::import("`RDKit`.Chem.Draw")
Plt <-  reticulate::import("matplotlib.pyplot")
AllChem <- reticulate::import("`RDKit`.Chem.AllChem")

mol <- Chem$MolFromSmiles(smiles)

filepath <- fs::path(path, chemical, ext = "png")
# Unlike the functions before this function just saves to file without calling
# knitr::include_graphics()
Draw$MolToFile(mol = mol, filename = filepath)
}
We’ll loop over the SMILES and Chemical names with the help of purrr’s walk2
function which allows for two vectors to be fed into a function simultaneously.
fs::dir_create("molecules")

table_chemicals <-
  # Allocate vectors to data frame
  data.frame(
  SMILES = multiple_smiles,
  Chemical = chemical,
  Source = source,
  stringsAsFactors = FALSE) %>%
  # Loop over the smiles and chemical names to save to file
  # Use possibly to catch any errors if there are any.
  mutate(
    savemol = purrr::walk2(
    SMILES, Chemical,
    purrr::possibly(~save_structure(
      smiles = .x,
      chemical = .y,
      path = "./molecules"),
      otherwise = "oh-no!"
      )
    )
    ) %>%
  mutate(
    # Record the path where images are stored. Convert to character the path
    # to allow flextable to handle the paths.
    structure_path = as.character(fs::path("molecules", Chemical, ext = "png")),
    # Leave one column empty for the eventual location of the image
    Structure = "",
    SMILES = stringr::str_wrap(SMILES, width = 34)
  )
Build the Flextable
To build the flextable I will be following along the gallery example for tennis players.
The first step is to initialize the flextable by using the flextable()
function. The columns to be displayed are provided as a character vector to the
argument col_keys.
table_chemicals_ft <-
  flextable::flextable(
    table_chemicals,
    col_keys = c(
       "SMILES", "Chemical", "Source", "Structure"
      )
    )
table_chemicals_ft
SMILES Chemical Source Structure O=C(N(C(C1=C(C(OC([H])([H]) Capsaicin Chili CCO Ethanol Rum CN1C=NC2=C1C(=O)N(C(=O)N2C)C Caffeine Coffee
[H])=C(O[H])C(=C1[H])[H])[H])([H])
[H])[H])C(C(C(C(C(=C(C(C([H])([H])
[H])(C([H])([H])[H])[H])[H])[H])
([H])[H])([H])[H])([H])[H])([H])
[H]
The object table_chemicals_ft still retains information from the other columns
even when they are not displayed. These columns can still be referenced from the
saved object. The function flextable::compose() can then be used to add images
to the flextable object. The column to be used to store the image is supplied
to the j argument as a character and the value argument is supplied with a
nested combination of as_paragraph() and as_image(), the last one which will
take the path where the images are located via its src argument. The width
and height arguments inside of as_image() can be used to control the final
size of the image in the table.
table_chemicals_ft <- flextable::compose(table_chemicals_ft,
    # Specify the column which will contain the composed information
    j = "Structure",
    value = as_paragraph(as_image(src = structure_path, width = 1.5, height = 1.5))
    )
Finally, we can add some light weight formatting to the table for final display.
table_chemicals_ft <- flextable::theme_vanilla(table_chemicals_ft) %>%
      flextable::autofit()
table_chemicals_ft
SMILES Chemical Source Structure O=C(N(C(C1=C(C(OC([H])([H]) Capsaicin Chili CCO Ethanol Rum CN1C=NC2=C1C(=O)N(C(=O)N2C)C Caffeine Coffee
[H])=C(O[H])C(=C1[H])[H])[H])([H])
[H])[H])C(C(C(C(C(=C(C(C([H])([H])
[H])(C([H])([H])[H])[H])[H])[H])
([H])[H])([H])[H])([H])[H])([H])
[H]


flextable provides a broad range of outputs. It can save files to html,
word and powerpoint making it very versatile when creating reports and
presentations. The R community
has a variety of tabular formats that would also be worth exploring to handle
chemical information.
There are efforts to bring some of the functionality of RDKit into the R ecosystem, such as the nicely looking repository tidychem. The author from tidychem outlines a vision for the integration of RDKit with R. If you are interested in learning more about RDKit, good resources are the YouTube videos by Jan Jensen or the website Is life worth living?.
In future posts, I will discuss how we can source SMILES, SDF’s and chemical related information using R.